Are There Examples of Overhang for Other Technologies?
TL;DR: No.
What Do I Mean By ‘Overhang’?
Hardware Overhang for AI
One major concern about pausing AI development, from a purely safety perspective, is the possibility of hardware overhang.1 Here is the concern as I understand it:
Suppose a policy were put in place tomorrow that banned all progress in AI capabilities anywhere in the world for the next five years.2 Afterwards, the ban would be completely lifted.
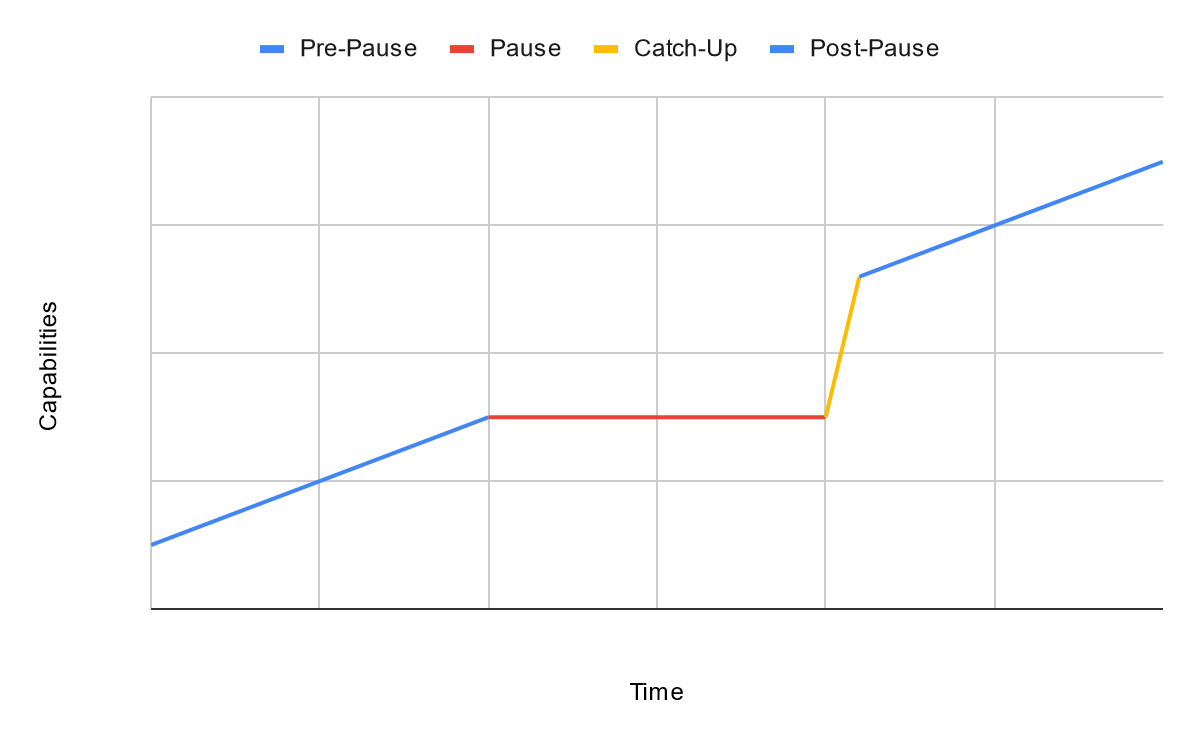
Hardware would continue to progress during this AI pause. Immediately after the pause ended, it would be possible to train new AI systems using significantly more compute than was previously possible, taking advantage of the improved hardware. There would be a period of extremely rapid growth, or perhaps a discontinuity,3 until the capabilities returned to their previous trend. Figure 1 shows a sketch of what we might expect progress to look like.
Figure 1: What AI progress might look like if there were a temporary pause in capabilities progress. The ‘overhang’ is the difference between what AI capabilities currently are as a result of the pause and what AI capabilities could be if the pause had never been enacted, or were completely lifted.
It might be worse for safety to have a pause followed by extremely rapid growth in capabilities than to have steady growth in capabilities over the entire time frame. AI safety researchers would have less time to work with cutting edge models. During the pause, society would have less time to become accustomed to a given level of capabilities before new capabilities appeared, and society might continue to lag behind for some time afterwards.
If we knew that there would be catch-up growth after a pause, it might be better to not pause AI capabilities research now and instead hope that AI remains compute constrained so progress is as smooth as possible.
We do not know if there would be extremely rapid growth after a pause. To better understand how likely hardware overhang would be, I tried to find examples of hardware-overhang-like-things for other technologies.
Overhang for Other Technologies
Many technologies have an extremely important input - like GPUs/TPUs for AI, or engines for vehicles, or steel for large structures. Progress for these technologies can either come from improvements in the design of the technology itself or it can come from progress in the input which makes it easier to improve the technology. For AI, this is the distinction between algorithmic progress and hardware progress.
I am being purposefully vague about what ‘progress’ and ‘input’ mean here. Progress could be in terms of average cost, quantity produced, or some metric specific to that technology. The input is often something very particular to that technology, although I would also consider the general industrial capacity of society as an input. The definition is flexible to include as many hardware-overhang-like-things as possible.
It is possible for there to be a pause in progress for the technology itself, perhaps due to regulation or war, without there being a pause in progress for the inputs. The pause should be exogenous: it is a less interesting analogy for AI policy if further progress became more difficult for technical reasons particular to that technology.4 It is possible for AI progress to pause because of technical details about how hard it is to improve capabilities, and then for a new paradigm to see rapid growth, but this is a different concern than overhang due to AI policy. Exogenous pauses are cases where we might expect overhang to develop.
Examples of Overhang
Methods
To find examples of overhang, I looked in the data for our Discontinuous Progress Investigation5 and in the Performance Curve Database.6 The Performance Curve Database contains 135 entries, most of which include both average cost and production quantity as a function of time. The Discontinuous Progress Investigation contains 21 case studies. The specific metric or metrics for each case study is different, but it should be a proxy for how ‘good’ a particular technology is and it should have sufficient historical data to establish a trend. Most of these only include record performance on this metric. In total, I looked at several hundred graphs of some notion of progress for a technology.
I initially looked for data which had a similar shape to Figure 1: a clear trendline showing growth, followed by a pause, followed by rapid growth and a return to the previous trendline. If I found this pattern, I would then try to figure out the cause of the pause and the subsequent growth. If the pause was caused by an external factor, and the subsequent growth was driven by having better inputs, then this would be an example of overhang.
I also thought of technologies which were banned, and for which the ban was later completely reversed, to check whether they follow the pattern predicted by overhang.
The Closest Example I Found: Land Speed Records
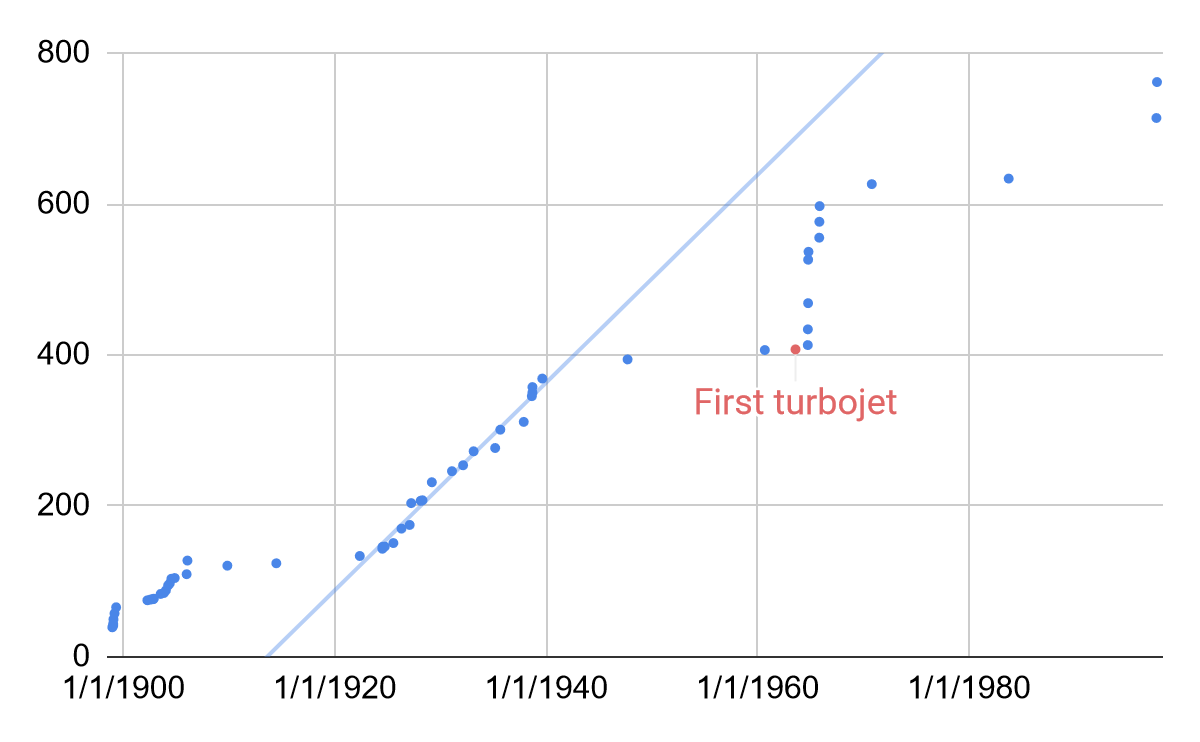
Figure 2 shows the fastest any vehicle traveled on land over a distance of either 1 km or 1 mi from 1900 to 2000, according to Wikipedia.
Figure 2: Historic land speed records in mph over time. Speeds on the left are an average of the record set in mph over 1 km and over 1 mile. The red dot represents the first record in a cluster that was from a jet propelled vehicle.7 The trendline shown is fit to the data from 1920-1940 and extrapolated.
This data shows several pauses. The most interesting one for this blog post is from 1939 to 1963. The first pause had similar growth before and after the pause, with no catch-up growth, and the last pause has less data to establish a clear trendline after the pause.
In 1939, progress in the land speed record abruptly stopped. No new records were set until 1947, and significant progress on this metric did not resume until 1963. Then there was extremely rapid progress over the next two years. This looks like catch-up growth, although it did not quite reach the previous trendline. It also was not sustained, and the catch-up growth was followed by another pause.
The explanation for this pattern follows what we would expect for overhang. The important input is the engine: having a more powerful engine is extremely important for making a car go fast. The exogenous source of the pause was WWII, which caused industrial capacity to shift towards more strategically important technologies. During WWII, engine progress continued. In particular, jet engines were developed for aircraft. Jet engines were initially reserved for military aircraft, and were not widely available for private buyers until after 1958, when the Boeing 707 entered service. In 1963, the land speed record was broken by a car with a jet engine for the first time, which began a period of rapid progress.
One other consideration for the land speed record is that it is not strategically or economically important, especially after WWII, so relatively small amounts of resources have been devoted to it. The most expensive record-breaking land vehicles cost millions or tens of millions of dollars.8 If this were a more important technology, someone might have built a car with a jet engine earlier, leading to more continuous growth.
This is the only example I found which had an exogenous pause, and then faster growth after the pause.
Endogenous Pauses: Optical Cables and Particle Accelerators
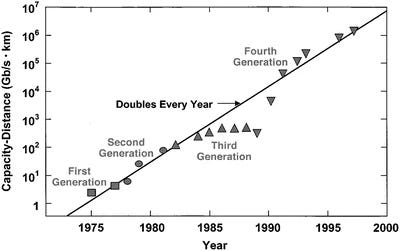
The data I found that looks most like Figure 1 involves optical cables, and is shown in Figure 3. There is a clear trend, followed by a pause, followed by rapid growth that catches up to the previous trendline. The trend continues for another decade beyond the edge of this graph, through generations 5 & 6.
Figure 3: Bandwidth-distance product in fiber optics alone,9 from Agrawal, 2016.10
This figure comes from a book chapter (Agrawal, 2016) which also explains the history. The cause of the pause was endogenous: it was determined by technical details of the technology itself, rather than something external. The original trendline is actually a combination of S-curves, each of which corresponds to a significant change in the design of the cables, called a ‘generation’ of the technology. The transition between most generations required a single significant change. The transition between generations 3 & 4 required three simultaneous changes to work. This explains why the transition occurred later, and resulted in more rapid growth, than the other transitions.
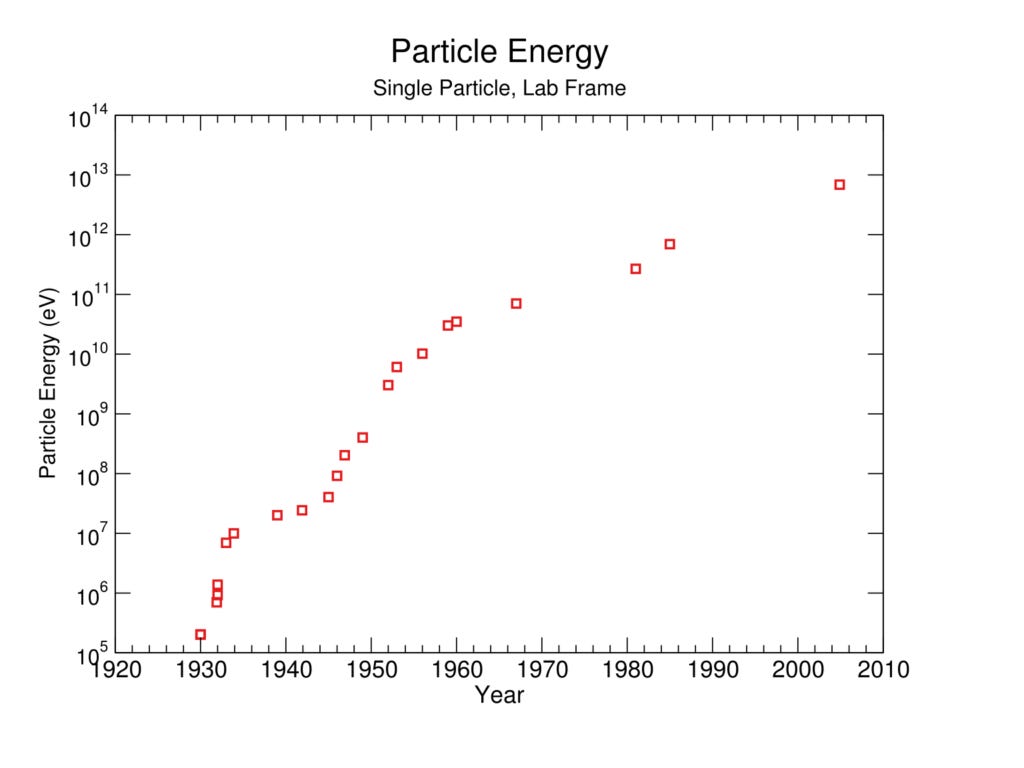
Particle accelerators have followed a similar pattern as optical cables, as shown in Figure 4. There are periods of slower growth, followed by periods of rapid growth. The slower growth was caused by diminishing returns to existing designs, and the faster growth was caused by new accelerator designs.11 The result is again a combination of S-curves. This pattern can be entirely explained by factors internal to the technology, rather than anything exogenous.
Figure 4: Record center of mass energy for a particle-particle collision in a particle accelerator from 1920 to 2010. Note the three distinct S-curves from about 1930-1945, 1945-1970, and 1970-2010.12
While this is an interesting way that a technology can develop, it is not a precedent for hardware overhang developing as a result of AI policy.
Prohibition of Alcohol
One example of a technology which was banned, and for which the ban was then completely reversed, is the Prohibition of alcohol in the US from 1920-1933.
The real cost of producing alcohol has fallen over time, as expected for a manufactured good.13 During Prohibition, general industrial practices in the US improved substantially, and alcohol continued to be produced at scale in other countries, likely resulting in continued progress there. This seems like a situation where overhang might develop.
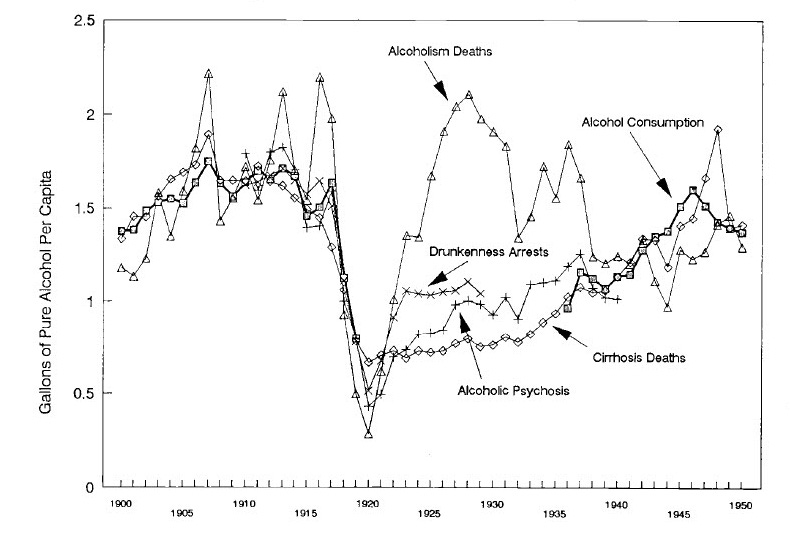
Unfortunately, I have not been able to find data on the cost of producing alcoholic beverages14 before and after Prohibition. The way economic data are reported changed significantly during the early 1900s, so it is difficult to compare data before15 to data after.16 There are data and proxies for the consumption of alcohol before, during, and after Prohibition, shown in Figure 5, which show lower consumption after Prohibition than before. This does not suggest a significant reduction in the cost of alcohol immediately after Prohibition ended.
Figure 5: Alcohol consumption before and after Prohibition (squares, thicker line) and several proxies for alcohol consumption during Prohibition. Plot from Miron & Zwiebel, 1991.17
Other Examples?
These are the best examples of overhang I have been able to find. None of them match the behavior that people seem to expect will happen with hardware overhang.
Most of the data series seem even less like overhang than these. Many do not have clear trendlines, which makes them hard to interpret. Many have pauses followed by similar or slower growth. When there is a discontinuity in technological progress (which is uncommon, but exists), it is more likely to be preceded by accelerating growth than by a pause.
If you are aware of any technology where you think overhang might have occurred, please let me know in the comments below.
Why Are There No Good Examples Of Overhang?
This section is more speculative than the previous section.
The lack of examples of overhang for other technologies makes me skeptical that this would happen for AI. Catch-up growth for a particular technology after a pause is at least uncommon.
Here are some possible explanations I have considered for the observed lack of overhang. Feel free to suggest more in the comments.
There’s Nothing So Permanent as a Temporary Government Program
One premise of overhang is that a ban on progress for a particular technology would be enacted for a certain amount of time, and then completely ended. This is not how regulations normally work.18
There are lots of things which are regulated, many of which require complicated standards or enforcement mechanisms.19 It is easier to enact a regulation than it is to repeal a regulation. This is known as the ‘regulatory ratchet.’20 Legislatures and regulatory agencies have a mandate to pass new laws or regulations in response to problems. While they also have the power to repeal regulation, there is typically less incentive for them to work on repeals. Sunset laws might make this more symmetric, but they are uncommon.
Even if a ban is initially temporary, it is likely to be extended. The political coalition which was successful at getting the temporary ban enacted will still exist as the ban nears its end date. They were powerful enough to win before, and now they have status quo bias on their side. The industry which opposes the ban likely has less money and influence as a result of the ban. We should expect most new regulation to be permanent, unless its consequences are so visibly bad21 that it empowers a reaction much stronger than the initial movement. Even when a political party makes repealing a particular piece of legislation a central plank of their platform, and then wins major electoral victories, it is still hard to get the legislation repealed.22
When a ban is reversed, it is unlikely to be fully reversed. Bans which are temporary are sometimes enacted to give the relevant community time to figure out what good policies are. The ban ends when these policies are enacted, but the new policies often maintain some restrictions from the previous ban. The Asilomar Conference on Recombinant DNA follows this pattern. In 1974, the National Academy of Sciences (NAS) enacted a temporary ban23 on all experiments involving recombinant DNA, in response to concerns about biohazardous experiments. The Asilomar Conference in 1975 prohibited certain kinds of experiments, and provided recommendations for other experiments. After Asilomar, the total ban was reversed, and replaced with these strict guidelines.24 Some of these guidelines have since been scaled back, but regulation on recombinant DNA remains stricter than it was before the temporary ban.
Dispelling the Hype
Emerging technologies depend on hype. They are often not currently profitable, so they rely on promises of future success to acquire the resources they need. Without the hype, startups would fail and established companies would shift their investments elsewhere.25
Increasing regulations or bans are effective ways to dispel hype, even if they are enacted temporarily. People would (reasonably) expect that they might not be temporary. The ban is a strong signal to the private sector and foreign countries that this technology is not going to be the next big thing and reduces their expected value for pursuing it. The hype seems unlikely to fully return after a ban is lifted.
There are two main resources driven by hype: venture capital and talent.
Venture capital is the most obvious resource fueled by hype. Investors know that startups are promising more than they can currently deliver, but believe that there is a good enough chance that they will be able to deliver in the future that they are worth investing in. If something happens that makes investors think that startups in a field will systematically not be able to deliver, that available capital can quickly shift elsewhere.
Talent responds more slowly than capital. If there is a ban that is expected to last more than a few years, then students who are choosing their careers are less likely to want to go into that field, and people who currently work in the field are more likely to consider switching careers. While venture capital might quickly return after a ban is lifted, re-recruiting talent that has gone elsewhere would take longer.
Reduced Demand for the Input
Overhang assumes that progress for the input will continue to develop during the pause, the same as if the pause did not occur.
It is not obvious if this would be the case for AI. AI is one of the major markets for GPUs and is the sole market for TPUs. We should expect counterfactually less progress in GPUs & TPUs as a result of AI regulation.
It might be different if the technology which was paused accounts for a small fraction of the total market of the input. Extremely fast cars account for effectively none of the market for jet engines.
For technologies which account for a larger fraction of the demand for their inputs, progress in their inputs is less likely to continue at the same rate if they are paused. They would have less catch-up growth immediately available afterwards.
Conclusion
I do not think that technologies typically develop overhang if they are subject to an exogenous pause. I know of no good examples of overhang from other technologies.
There are several plausible reasons why overhang is uncommon. Most regulations are not temporary, most ‘temporary’ regulations or bans are extended, and when bans are ended, this is often accompanied by stricter regulation than there was before. Temporary bans can dispel the hype surrounding an emerging technology causing venture capital and (more slowly) talent to leave the field. The assumption that progress in the input continues the same as before if one of its major customers gets paused also seems suspect.
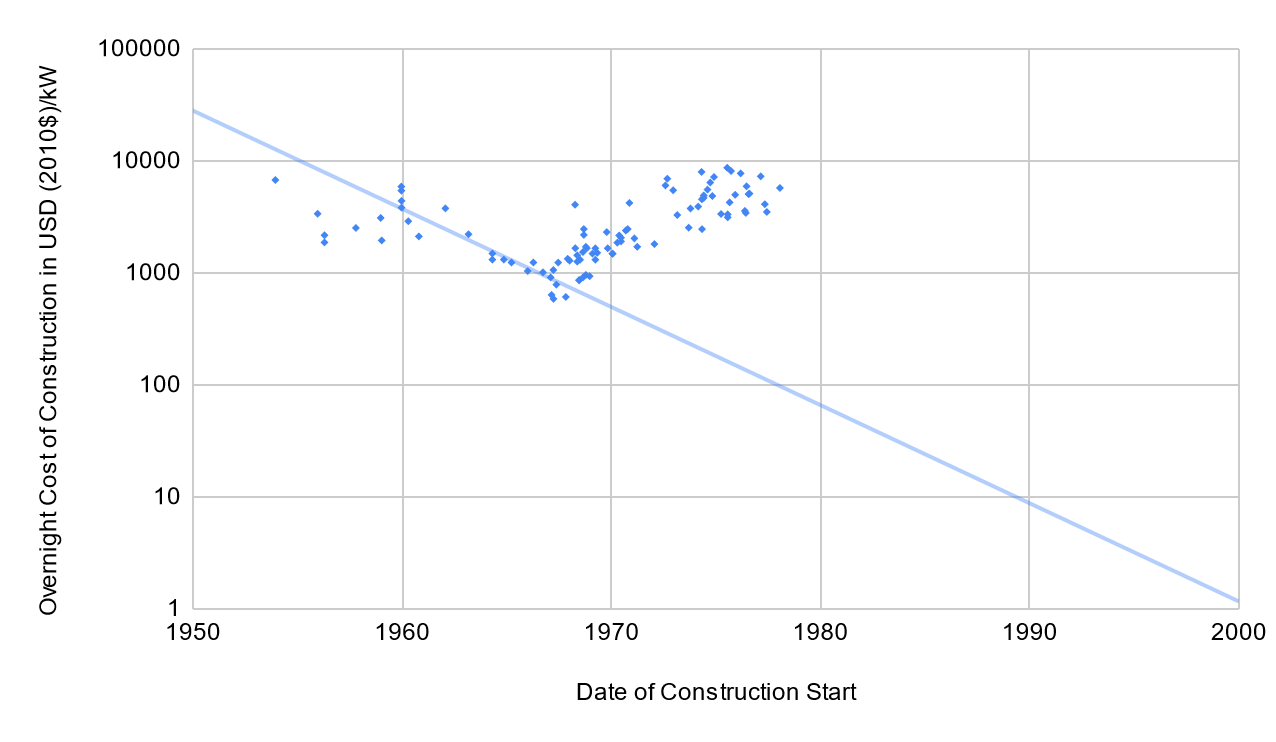
As an example of how people do not expect overhang elsewhere, consider nuclear power. Nuclear power was getting steadily cheaper in the 1960s. Then, increasing safety regulation applied to nuclear power caused the learning curve to reverse, and the cost of building new nuclear reactors increased dramatically.26 Nuclear power advocates argue that, if we reduced regulations on nuclear power to a more reasonable level, we could see prices drop by a factor of 10 to return to the construction costs of the 1960s. Nuclear power advocates do not extrapolate the trendline from the 1960s to today and predict that, if this regulation were repealed, nuclear power would suddenly become 106 times cheaper than it is today, which is what we would expect if the overhang model applied. Extrapolating all the way to today is probably unreasonable: there’s a good chance that nuclear power would not have followed the trendline for that long anyway.27 Nuclear power advocates’ optimistic views are less optimistic than what they would expect if they predicted even partial overhang.
Figure 6: Trendline for nuclear power plant construction costs in the US. Data are from Lovering et al.28 and digitized using WebPlotDigitizer.29 The trendline is fit to data from 1963-1966 and extrapolated to the year 2000. Extrapolating to 2023 results in two orders of magnitude of further cost reduction.
I think that hardware overhang can still be worth considering as something bad and plausible, but we should not treat overhang as the default or most likely future if there is a temporary pause in AI development. It seems more likely that AI progress would resume at a similar or slower rate after the ban is lifted, if it is lifted at all.
Thanks to Rick Korzekwa, Harlan Stewart, Zach Stein-Perlman, Rocket Drew, McKenna Fitzgerald, Ryan Kidd, Curt Tigges, and Alex Gray for helpful discussions on this topic.
Zach Stein-Perlman. Cruxes for overhang. AI Impacts Blog. (2023) https://blog.aiimpacts.org/p/cruxes-for-overhang.
This blog post does not consider how this would be implemented. The focus is on what the effects would be if it were.
I am using ‘discontinuity’ in the sense of our discontinuous progress investigation:
Discontinuous progress investigation. AI Impacts Wiki. (Accessed December 5, 2023.) https://wiki.aiimpacts.org/ai_timelines/discontinuous_progress_investigation.
This is not that uncommon. There are examples of progress for a particular technology stopping:
Examples of Progress for a Particular Technology Stopping. AI Impacts Wiki. (Accessed December 5, 2023.) https://wiki.aiimpacts.org/ai_timelines/examples_of_progress_for_a_particular_technology_stopping.
Discontinuous progress investigation. AI Impacts Wiki. (Accessed December 5, 2023.) https://wiki.aiimpacts.org/ai_timelines/discontinuous_progress_investigation.
Performance Curve Database. Santa Fe Institute. (Accessed December 6, 2023.) https://pcdb.santafe.edu.
Historic trends in land speed records. AI Impacts Wiki. (Accessed December 5, 2023.) https://wiki.aiimpacts.org/doku.php?id=takeoff_speed:continuity_of_progress:historic_trends_in_land_speed_records.
Dominik Wilde. Bloodhound Land Speed Record Project Enters Administration. Motor1 (2018) https://www.motor1.com/news/270039/bloodhound-land-speed-administration/.
Historic trends in telecommunications performance. AI Impacts Wiki. (Accessed December 5, 2023.) https://wiki.aiimpacts.org/takeoff_speed/continuity_of_progress/historic_trends_in_telecommunications_performance?s[]=fiber&s[]=optics#easy-footnote-bottom-12-1368.
Govind P. Agrawal. Optics in Our Time. Ch. 8: Optical Communication: Its History and Recent Progress. Figure 8.8. (2016) p. 177-199. https://link.springer.com/chapter/10.1007/978-3-319-31903-2_8.
Short History of Particle Accelerators. CERN. (2006) p. 45. https://cas.web.cern.ch/sites/default/files/lectures/zakopane-2006/tazzari-history.pdf.
Historic trends in particle accelerator performance. AI Impacts Wiki. (Accessed December 5, 2023.) https://wiki.aiimpacts.org/takeoff_speed/continuity_of_progress/historic_trends_in_particle_accelerator_performance.
The cost of alcohol at home has increased by 44% from 2000-2023, compared to a 79% increase in costs overall.
Stefan Skyes. Here’s how the price of your beer has changed over time. CNBC. (2023) https://www.cnbc.com/2023/06/02/here-is-why-beer-prices-are-going-up-according-to-our-data.html.
I have found several data series on ethyl alcohol covering this time frame, but this was not banned:
FRED. Price of Ethyl Alcohol, Grain for New York. St. Louis Fed. (Accessed December 5, 2023.) https://fred.stlouisfed.org/series/M04177US000NYM054NNBR.
FRED. Ethyl Alcohol Production for United States. St. Louis Fed. (Accessed December 5, 2023.) https://fred.stlouisfed.org/series/M01226USM441NNBR.
FRED. Ethyl Alcohol Stocks, at Warehouses for United States. St. Louis Fed. (Accessed December 5, 2023.) https://fred.stlouisfed.org/series/M05043USM441NNBR.
Data before Prohibition tend to involve prices for particular goods, found by having government officials ask wholesale suppliers what they pay to purchase them. See, for example:
Carroll D. Wright. Comparative wages, prices, and cost of living. Sixteenth annual report of the Massachusetts Bureau of Statistics of Labor. (1885) p. 126-129. https://babel.hathitrust.org/cgi/pt?id=hvd.32044050806330&seq=141.
Carroll D. Wright. Bulletin of the Department of Labor 27. (1900) p. 260. https://fraser.stlouisfed.org/files/docs/publications/bls/bls_v05_0027_1900.pdf?utm_source=direct_download.
Wholesale Prices 1890 to 1913. Bulletin of the United States Bureau of Labor Statistics 149. (1914) p. 164. https://fraser.stlouisfed.org/title/wholesale-prices-160/wholesale-prices-1890-1913-497569.
Data after Prohibition tend to involve total personal expenditures on alcohol or total alcohol produced by the country as a whole. See, for example:
FRED. Personal consumption expenditures: Nondurable goods: Alcoholic beverages purchased for off-premises consumption. St. Louis Fed. (Accessed December 6, 2023.) https://fred.stlouisfed.org/series/DAOPRC1A027NBEA.
FRED. Personal consumption expenditures: Nondurable goods: Alcoholic beverages purchased for off-premises consumption (chain-type price index). St. Louis Fed. (Accessed December 6, 2023.) https://fred.stlouisfed.org/series/DAOPRG3A086NBEA.
FRED. Personal consumption expenditures: Nondurable goods: Alcoholic beverages purchased for off-premises consumption (chain-type quantity index). St. Louis Fed. (Accessed December 6, 2023.) https://fred.stlouisfed.org/series/DAOPRA3A086NBEA.
Jeffrey A. Miron and Jeffrey Zwiebel. Alcohol Consumption During Prohibition. NBER Working Papers Series 3675. (1991) https://www.nber.org/papers/w3675.
A recent preprint looked at the persistence of policies decided by small margins in state referendums. It found that the likelihood that a policy remains in effect initially declines from 100% to about 40% over a few decades, then plateaus. Even a century later, 40% of the closely decided referenda remained in force, in some cases despite becoming less popular with the general public.
Zach Freitas-Groff. Persistence in Policy: Evidence from Close Votes. (2023) https://zachfreitasgroff.b-cdn.net/FreitasGroff_Policy_Persistence.pdf.
Examples of Regulated Things. AI Impacts Wiki. (Accessed December 11, 2023). https://wiki.aiimpacts.org/responses_to_ai/examples_of_regulated_things.
Mark R. Lee. The Regulatory Ratchet: Why Regulation Begets Regulation. University of Cincinnati Law Review 87.3. (2019) https://scholarship.law.uc.edu/cgi/viewcontent.cgi?article=1286&context=uclr.
Note that regulation does not just have to be bad: it has to be very visibly bad. Very impactful legislation does not have to be visible, if it is felt through slower than counterfactual economic growth, for example.
Examples include Democrats’ opposition to the Bush tax cuts and Republicans’ opposition to Obamacare. The Bush tax cuts were set to expire after 10 years, but in 2013 they were made permanent for individuals making less than $400,000 per year. Republicans ran opposing Obamacare for years, but once they were in full control of the government, they were unable to repeal it. The biggest change they were able to make was setting the penalty of the individual mandate to zero in 2019. Lower profile legislation is even less likely to be repealed.
The NAS is a nonprofit organization, which does not have the power to enforce its policies. It was influential enough that their ban was followed, and it often advises regulatory agencies’ policy decisions.
Paul Berg. Asilomar 1975: DNA modification secured. Nature 455. (2008) p. 290-291. https://www.nature.com/articles/455290a.
While the NAS does not enforce the guidelines itself, the NIH requires them in order to receive funding.
My not particularly well informed model of the dot com bubble and crash is that it was primarily driven by hype. The internet was the next big thing, so resources poured into it - more so than could be productively used. Once people realized that this was a bubble, the hype dissipated and the market crashed. This is an example of hype being dispelled private, while this blog post discusses government action which dispels the hype.
Jason Crawford. Why Nuclear Power Has Been A Flop. Roots of Progress. (2021) https://rootsofprogress.org/devanney-on-the-nuclear-flop.
Examples of Progress for a Particular Technology Stopping. AI Impacts Wiki. (Accessed December 5, 2023.) https://wiki.aiimpacts.org/ai_timelines/examples_of_progress_for_a_particular_technology_stopping.
Lovering, Yip, & Nordhaus. Historical construction costs of global nuclear power reactors. Figure 2. Energy Policy 91. (2016) p. 371-382. https://www.sciencedirect.com/science/article/pii/S0301421516300106.
Ankit Rohatgi. WebPlotDigitizer 4.6. (Accessed December 4, 2023) https://apps.automeris.io/wpd/.

I expect many technologies to not develop a hardware overhang because the bottleneck is R&D into the technology in question itself. For AI, the bottleneck might be compute, which will keep getting cheaper regardless of whether we pause frontier AI.
This is a really nice analysis of something that it would not have occurred to me would be susceptible to analysis. Nicely done!